Original (English)
Chart Viewer and Visual Debugger
A click on the [Result] button after a test run opens the chart viewer and debugger. It allows to zoom and scroll from an overview of the whole simulation down to a single day or hour, and can replay or single step through the strategy for debugging purposes. Charts can be exported and stored as images, or already generated as images..
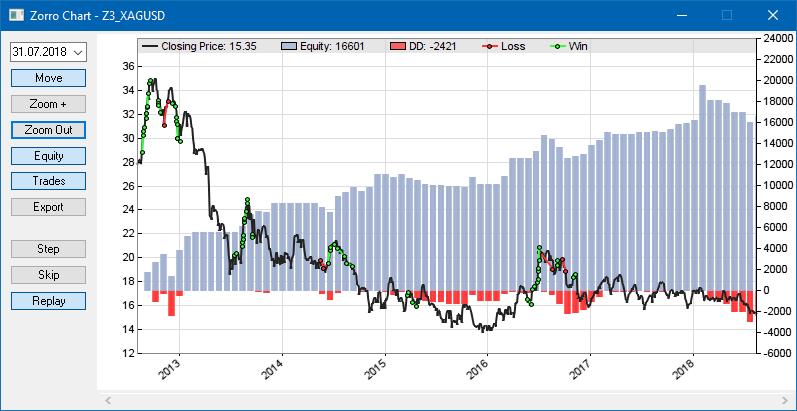
The chart runs from the begin of the first test cycle (not identical to the StartDate) to the end of the last test cycle. By default it displays equity and drawdown profiles (blue and red), the price curve (black), and the trades of the asset selected with the [Asset] scrollbox. For displaying a different asset, select it with the scrollbox and click [Result] again.
The chart uses the same time zone as the historical data, normally UTC. The left axis is the asset price, the right axis is the profit or loss in account currency units. Any axis runs from the minimum to the maximum value within the chart. Trade entry and exit points are connected with green or red lines for winning or losing trades. A falling green line or a rising red line indicates a short position. For option trades the lines connect the strike prices with underlying exit prices.
Equity and drawdown profiles are summed up from the whole portfolio and averaged over all oversampling cycles. If Capital is invested, it adds to the equity curve dependent on PlotMode settings. In BALANCE mode the blue profile displays the balance rather than the equity, in PIPRETURN mode it's the volume-independent profit in pips. The red "underwater profile" is normally the drawdown, the equity distance from a preceding balance peak. In MAECAPITAL mode it's the adverse excursion from a preceding equity peak and thus 'mirrors' the top of the equity curve. In PL_BENCHMARK mode the equity curve is plotted as a blue line rather than bars, for comparison with buy-and-hold or market profit lines. Additional curves appear either on or below the main chart, depending on plot settings.
Candles are displayed when zooming in; otherwise the price curve is a black line. In the chart below, a short trade was opened on 16 at market open and closed intraday on Aug 8, probably by a trailing stop. A close at bar end by an exit command would have placed the end dot next to the close of the candle.
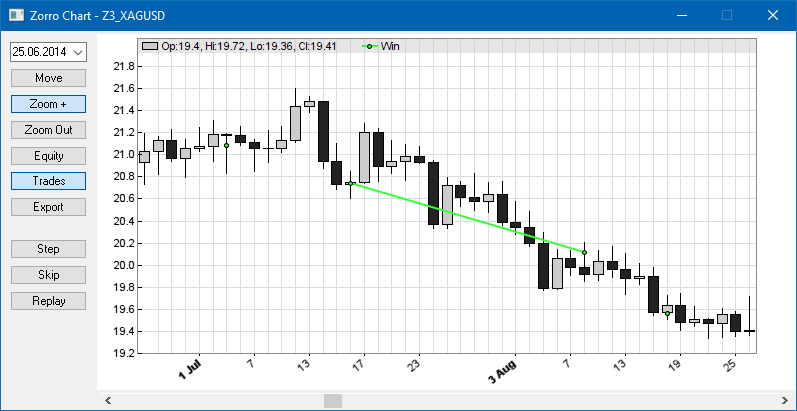
Chart elements can be switched off either with the buttons on the left side,
or by setting their Color to 0.
| ||||||||||||||||||||||||||
The price curve with the displayed trades can be selected with the [Assets] scrollbox; afterwards click [Result] again for refreshing the chart. The equity or balance curve results from the sum of all trades of the portfolio. The underlying datasets of a chart can be exported and further evaluated with third party charting software, f.i. an R data analysis package.
In PL_FILE mode, the chart is initally generated as a .png image in the Log folder and displayed with the ZView image viewer. Elements can be removed from the chart image by setting their corresponding Color parameters to 0. The size, scale, and resolution of the chart image can be set up with plot parameters. The number of bars per chart can be limited with the PlotBars variable.
Remarks
- In [Trade] mode a chart image is part of the .htm status page. It can be displayed in a web browser and is updated after every PlotPeriod (default: 1 hour). It is not a live chart, but a snapshot of the last update point.
- In [Train] mode parameter charts are exported to image files and displayed on the training result page.
- The start point of a trade triggered at the end of a bar is displayed in the chart on the next bar, regardless of the selected Fill mode.
- For bar charts the last position and zoom factor are preserved until the [Edit] button is clicked or a different script is selected.
- On zooming horizontally, the vertical zoom is automatically adjusted so that it covers all plot elements inside the range. This can cause 'flat' candles when plot elements, f.i. by plotGraph, are far away from the price line.
- Charts with many sub-charts (more than 15) can be difficult to view even with a large window size. If required, generate them as images with setf(PlotMode,PL_FILE); and display them in the ZView image viewer that is included in the Zorro distribution.
- The text in the caption bar of the current chart can be changed with print(TO_CHART,...).
- For comparing charts or histograms of different strategy variants, export them
as images and open them with ZView in horizontal split
mode.
Debugging a strategy
You can replay or single step through a strategy for examining the trade behavior in detail. Use the [Asset] scrollbox to select the asset to be observed, then click [Step] or [Replay] for stepping through the backtest or replaying it in reduced speed. [Step] moves one bar forward, [Skip] moves to the next bar at which a trade opens or closes. The two buttons also appear on the Zorro main window.
Debugging opens the chart window at the current position, and another window with a list of open trades:
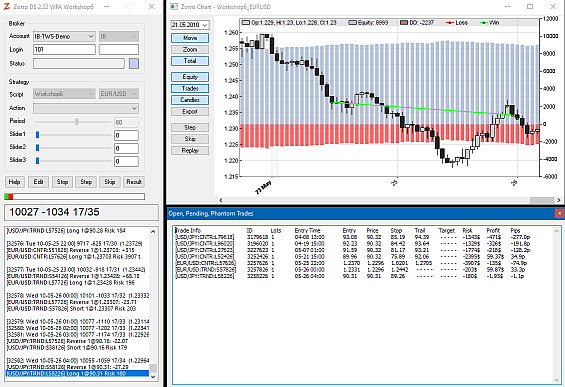
The trade list has the same format as on the live status page.
The stepwise change of variables and indicators can be visualized either with a watch statement, or by plotting them in the chart. For debugging single loops or function calls, place watch ("!...", ...) statements inside. [Step] will then not proceed to the next bar, but to the next watch statement. Stepwise debugging normally begins at the end of the LookBack period. For beginning at a certain date or bar number, call watch dependent on a condition, f.i. if(date() >= 20150401) watch("!...", ...);. Set the STEPWISE flag for starting the backtest already in debugging mode.
- For suggestions about writing clean code and dealing with bugs and errors in your script, read troubleshooting.
- For testing the behavior of a strategy under simulated market conditions, such as extreme drops, use an artificial price curve (see SHAPE).
- For quickly testing the robustness of your strategy, run it with a detrended or inverted price curve (see Detrend).
- For testing the live trading behavior at a certain date or in 'fast forward' mode, use DayOffset.
See also:
Testing, Colors, plot, watch, Troubleshooting, Performance ReportÜbersetzung (Deutsch)
Chart Viewer und Visueller Debugger
Ein Klick auf die [Result]-Taste nach einem Testlauf öffnet den Chart Viewer und Debugger. Er ermöglicht das Zoomen und Scrollen von einer Übersicht über die gesamte Simulation bis hin zu einem einzelnen Tag oder einer Stunde und kann die Strategie zum Debuggen in schneller Vorlauf- oder Einzelschritt-Methode abspielen oder Schritt für Schritt durchgehen. Charts können exportiert und als Bilder gespeichert oder bereits als Bilder generiert werden.
Der Chart läuft vom Beginn des ersten Testzyklus (nicht identisch mit dem StartDate) bis zum Ende des letzten Testzyklus. Standardmäßig zeigt er Equity- und Drawdown-Profile (blau und rot), die Preiskurve (schwarz) und die Trades des mit der [Asset]-Scrollbox ausgewählten Assets an. Um ein anderes Asset anzuzeigen, wähle es mit der Scrollbox aus und klicke erneut auf [Result].
Der Chart verwendet dieselbe Zeitzone wie die historischen Daten, normalerweise UTC. Die linke Achse zeigt den Asset-Preis, die rechte Achse zeigt den Gewinn oder Verlust in Kontowährungseinheiten. Jede Achse läuft vom Minimal- bis zum Maximalwert innerhalb des Charts. Ein- und Ausstiegspunkte von Trades sind mit grünen oder roten Linien für gewinnende oder verlierende Trades verbunden. Eine fallende grüne Linie oder eine steigende rote Linie zeigt eine Short-Position an. Bei Optionsgeschäften verbinden die Linien die Strike-Preise mit den zugrunde liegenden Ausstiegs-Preisen.
Equity- und Drawdown-Profile werden aus dem gesamten Portfolio summiert und über alle Oversampling-Zyklen gemittelt. Wenn Capital investiert ist, fügt es sich abhängig von den PlotMode-Einstellungen zur Equity-Kurve hinzu. Im BALANCE-Modus zeigt das blaue Profil das Guthaben statt der Equity an, im PIPRETURN-Modus ist es der volumenunabhängige Gewinn in Pips. Das rote "Underwater Profil" ist normalerweise der Drawdown, der Abstand der Equity von einem vorangegangenen Guthaben-Peak. Im MAECAPITAL-Modus ist es der adverse Ausbruch von einem vorangegangenen Equity-Peak und 'spiegelt' somit die Spitze der Equity-Kurve wider. Im PL_BENCHMARK Modus wird die Equity-Kurve als blaue Linie statt als Balken dargestellt, zum Vergleich mit Buy-and-Hold- oder Marktgewinnlinien. Zusätzliche Kurven erscheinen entweder oben oder unten im Hauptchart, abhängig von den Plot Einstellungen.
Kerzen werden angezeigt, wenn gezoomt wird; andernfalls ist die Preiskurve eine schwarze Linie. Im untenstehenden Chart wurde ein Short-Trade am 16 Uhr Marktöffnung eröffnet und intraday am 8. August geschlossen, wahrscheinlich durch einen Trailing Stop. Ein Schlusskurs am Ende der Bar durch einen Exit-Befehl hätte den Endpunkt neben dem Schlusskurs der Kerze platziert.
Chart-Elemente können entweder mit den Tasten auf der linken Seite
ein- oder ausgeschaltet werden,
oder indem ihre Farbe auf 0 gesetzt wird.
| ||||||||||||||||||||||||||
Die Preiskurve mit den angezeigten Trades kann mit der [Assets] Scrollbox ausgewählt werden; danach klicke erneut auf [Result] für das Aktualisieren des Charts. Die Equity- oder Guthaben-Kurve resultiert aus der Summe aller Trades des Portfolios. Die zugrunde liegenden Datensätze eines Charts können exportiert und weiter mit Drittanbieter Charting-Software ausgewertet werden, z.B. einem R-Datenanalyse Paket.
Im PL_FILE-Modus wird der Chart initial als .png-Bild im Log Ordner generiert und mit dem ZView Bildbetrachter angezeigt. Elemente können aus dem Chart Bild entfernt werden, indem ihre entsprechenden Farbe Parameter auf 0. gesetzt werden. Die Größe, Skalierung und Auflösung des Chart Bildes können mit Plot-Parametern eingestellt werden. Die Anzahl der Bars pro Chart kann mit der PlotBars Variable begrenzt werden.
Bemerkungen
- Im [Trade] Modus ist ein Chart-Bild Teil der .htm Statusseite. Es kann in einem Webbrowser angezeigt und nach jedem PlotPeriod (Standard: 1 Stunde) aktualisiert werden. Es ist kein Live Chart, sondern ein Schnappschuss des letzten Aktualisierungspunkts.
- Im [Train] Modus werden Parameter-Charts zu Bilddateien exportiert und auf der Trainings-Ergebnisseite angezeigt.
- Der Startpunkt eines Trades, der am Ende einer Bar ausgelöst wurde, wird im Chart in der nächsten Bar angezeigt, unabhängig vom gewählten Fill Modus.
- Bei Balkencharts werden die letzte Position und der Zoomfaktor beibehalten, bis die [Edit] Taste geklickt oder ein anderes Skript ausgewählt wird.
- Beim horizontalen Zoomen wird der vertikale Zoom automatisch angepasst, sodass alle Plot-Elemente innerhalb des Bereichs abgedeckt werden. Dies kann 'flache' Kerzen verursachen, wenn Plot-Elemente, z.B. durch plotGraph, weit vom Preislinie entfernt sind.
- Charts mit vielen Untercharts (mehr als 15) können schwer zu betrachten sein, selbst mit einer großen Fenstergröße. Falls erforderlich, generiere sie als Bilder mit setf(PlotMode,PL_FILE); und zeige sie im ZView Bildbetrachter an, der in der Zorro Distribution enthalten ist.
- Der Text in der Titelleiste des aktuellen Charts kann geändert werden mit print(TO_CHART,...).
- Zum Vergleichen von Charts oder Histogrammen verschiedener Strategieversionen, exportiere sie
als Bilder und öffne sie mit ZView im horizontalen Split
Modus.
Debugging einer Strategie
Du kannst eine Strategie abspielen oder Schritt für Schritt durchgehen, um das Handelsverhalten im Detail zu untersuchen. Verwende die [Asset] Scrollbox, um das zu beobachtende Asset auszuwählen, und klicke dann auf [Step] oder [Replay] zum Schritt-für-Schritt-Durchgehen des Backtests oder zum Abspielen in verlangsamtem Tempo. [Step] bewegt einen Bar vorwärts, [Skip] springt zum nächsten Bar, an dem ein Trade eröffnet oder geschlossen wird. Die beiden Tasten erscheinen auch im Hauptfenster von Zorro.
Das Debugging öffnet das Chart-Fenster an der aktuellen Position und ein weiteres Fenster mit einer Liste offener Trades:
Die Trade-Liste hat dasselbe Format wie auf der Live Statusseite.
Die schrittweise Änderung von Variablen und Indikatoren kann entweder mit einer watch Anweisung visualisiert werden, oder durch Plotten im Chart. Zum Debuggen einzelner Schleifen oder Funktionsaufrufe, platziere watch ("!...", ...) Anweisungen darin. [Step] fährt dann nicht zum nächsten Bar fort, sondern zum nächsten watch Statement. Schrittweises Debugging beginnt normalerweise am Ende der LookBack Periode. Um an einem bestimmten Datum oder Bar-Nummer zu beginnen, rufe watch abhängig von einer Bedingung auf, z.B. if(date() >= 20150401) watch("!...", ...);. Setze das STEPWISE Flag, um den Backtest bereits im Debugging-Modus zu starten.
- Für Vorschläge zum sauberen Code schreiben und zum Umgang mit Bugs und Fehlern in deinem Skript, lies Troubleshooting.
- Um das Verhalten einer Strategie unter simulierten Marktbedingungen, wie extreme Abfälle, zu testen, benutze eine künstliche Kurskurve (siehe SHAPE).
- Um die Robustheit deiner Strategie schnell zu testen, führe sie mit einer detrendeten oder invertierten Kurskurve aus (siehe Detrend).
- Um das Live-Trading-Verhalten an einem bestimmten Datum oder im 'Fast Forward' Modus zu testen, verwende DayOffset.