Normalization functions
The following functions can be used for normalizing and compressing time series
or indicator values to a range that's independent of the asset and time frame.
They suppress long-term trend and emphasize short cycles in various ways. Normalization is often required for machine learning algorithms.
center (var Value, int TimePeriod): var
Centers Value by subtracting its median over the TimePeriod. Using the median instead of the mean reduces the effect of outliers.
compress (var Value, int TimePeriod): var
Compresses Value to the -100...+100 range. For this, Value is divided by its interquartile range - the difference of the 75th and 25th percentile - taken over TimePeriod, and then compressed by a cdf function. Works best when Value is an oscillator that crosses the zero line. Formula: 200 * cdf(0.25*Value/(P75-P25)) - 100.
scale (var Value, int TimePeriod): var
Centers and compresses Value to the -100...+100 scale. The deviation of Value from its median is divided by its interquartile range and then compressed by a cdf function. Formula: 200 * cdf(0.5*(Value-Median)/(P75-P25)) - 100.
normalize (var Value, int TimePeriod): var
Normalizes Value to the -100...+100 range by subtracting its minimum and dividing by its range over TimePeriod. Formula: 200 * (Value-Min)/(Max-Min) - 100 .
For a 0..100 oscillator, multiply the returned value with 0.5 and add 50.
zscore (var Value, int TimePeriod): var
Calculates the Z-score of the Value. The Z-score is the deviation from the mean over the TimePeriod, divided by the standard deviation. Formula: (Value-Mean)/StdDev.
Parameters:
Value - Variable, expression, or indicator to be normalized.
TimePeriod - Normalization period.
Returns:
Normalized Value.
Remarks:
- The above functions generate series (see remarks).
- For converting a value X from a -100.+100 range to a
0...Y range, use the expression Y*(X+100)/200.
- There are other functions for compressing data series in various ways:
tanh compresses to the -1..1 range, sigmoid (= 1./(1.+exp(-x)) ) compresses to the 0..1 range,
Normalize and AGC compress
data series to -1..+1, PercentRank compresses to 0..100, and FisherN compresses so that most values fall inside -1.5..+1.5.
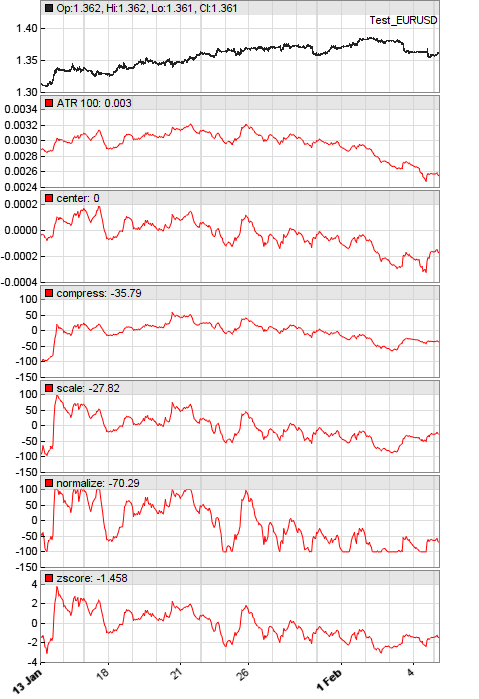
Example:
function run()
{
  set(PLOTNOW);
  PlotWidth = 600;
  PlotHeight1 = PlotHeight2;
  PlotBars = 400;
  LookBack = 200;
  var ATR100 = ATR(100);
  plot("ATR 100",ATR100,NEW,RED);
  plot("center",center(ATR100,100),NEW,RED);
  plot("compress",compress(ATR100-0.003,100),NEW,RED);
  plot("scale",scale(ATR100,100),NEW,RED);
  plot("normalize",normalize(ATR100,100),NEW,RED);
  plot("zscore",zscore(ATR100,100),NEW,RED);
}
See also:
AGC, FisherN, advise, cdf
► latest version online